photo sharing and upload picture albums photo forums search pictures popular photos photography help login
Mister Pixel | all galleries >> Galleries >> Forum Examples > EV vs ISO.jpg
previous | next

EV vs ISO.jpg

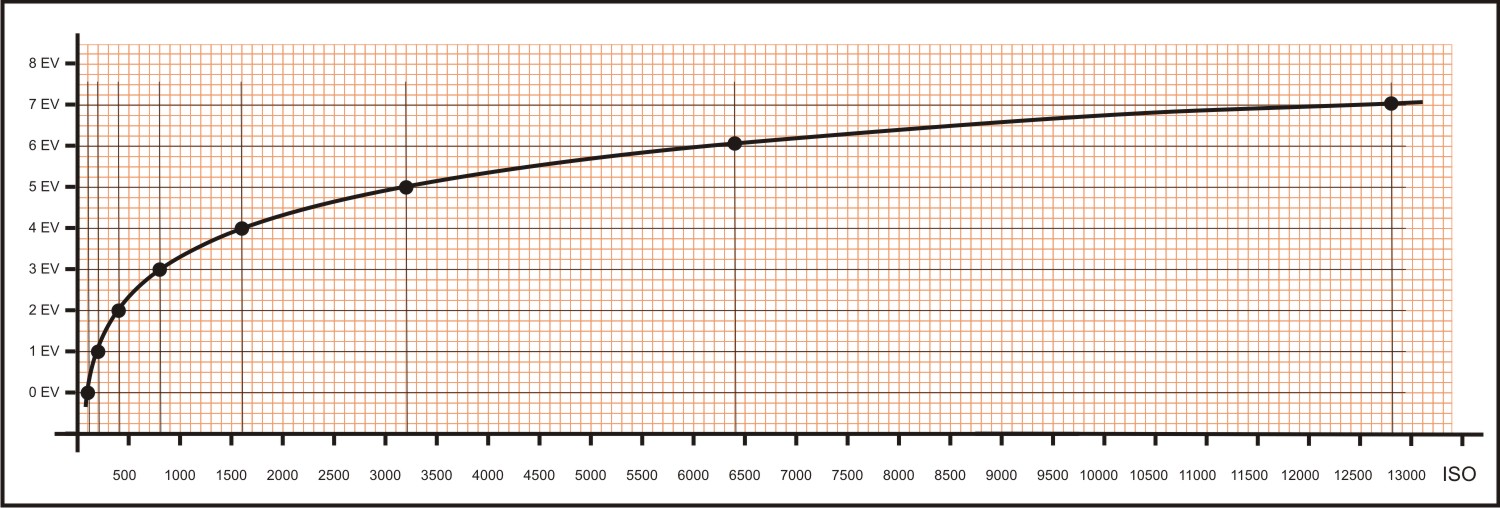
I created this graph to represent the EV (exposure value) differential starting with an arbitrary base ISO of 100.

The Y axis is in 0.25 EV increments and the X axis is in 100 ISO increments.

I've extrapolated the curve and added black lines to help identify the key XY intersections.


other sizes: small medium large original auto
share
Type your message and click Add Comment
It is best to login or register first but you may post as a guest.
Enter an optional name and contact email address. Name
Name Email
help private comment